AI-Driven Student Performance Analytics Dashboard
- Home
- Case-Study
- AI-Driven Student Performance Analytics Dashboard
Project category
EduTrack Insights Platform
Education / Academic Institutions
Canada
3 Months
Let’s build an AI-powered student performance analytics dashboard tailored to your institution’s needs.
Project Overview
An academic institution faced growing challenges in monitoring student outcomes and teaching effectiveness across departments and academic years.
Key issues included:
- Inconsistent student performance tracking across years
- Limited visibility into pass/fail trends and grade movement
- Difficulty evaluating teacher performance and experience impact
- Lack of data-backed insights for department-level decision-making
These gaps made it hard for leadership teams to identify at-risk students, reward effective teaching, and improve academic outcomes at scale.
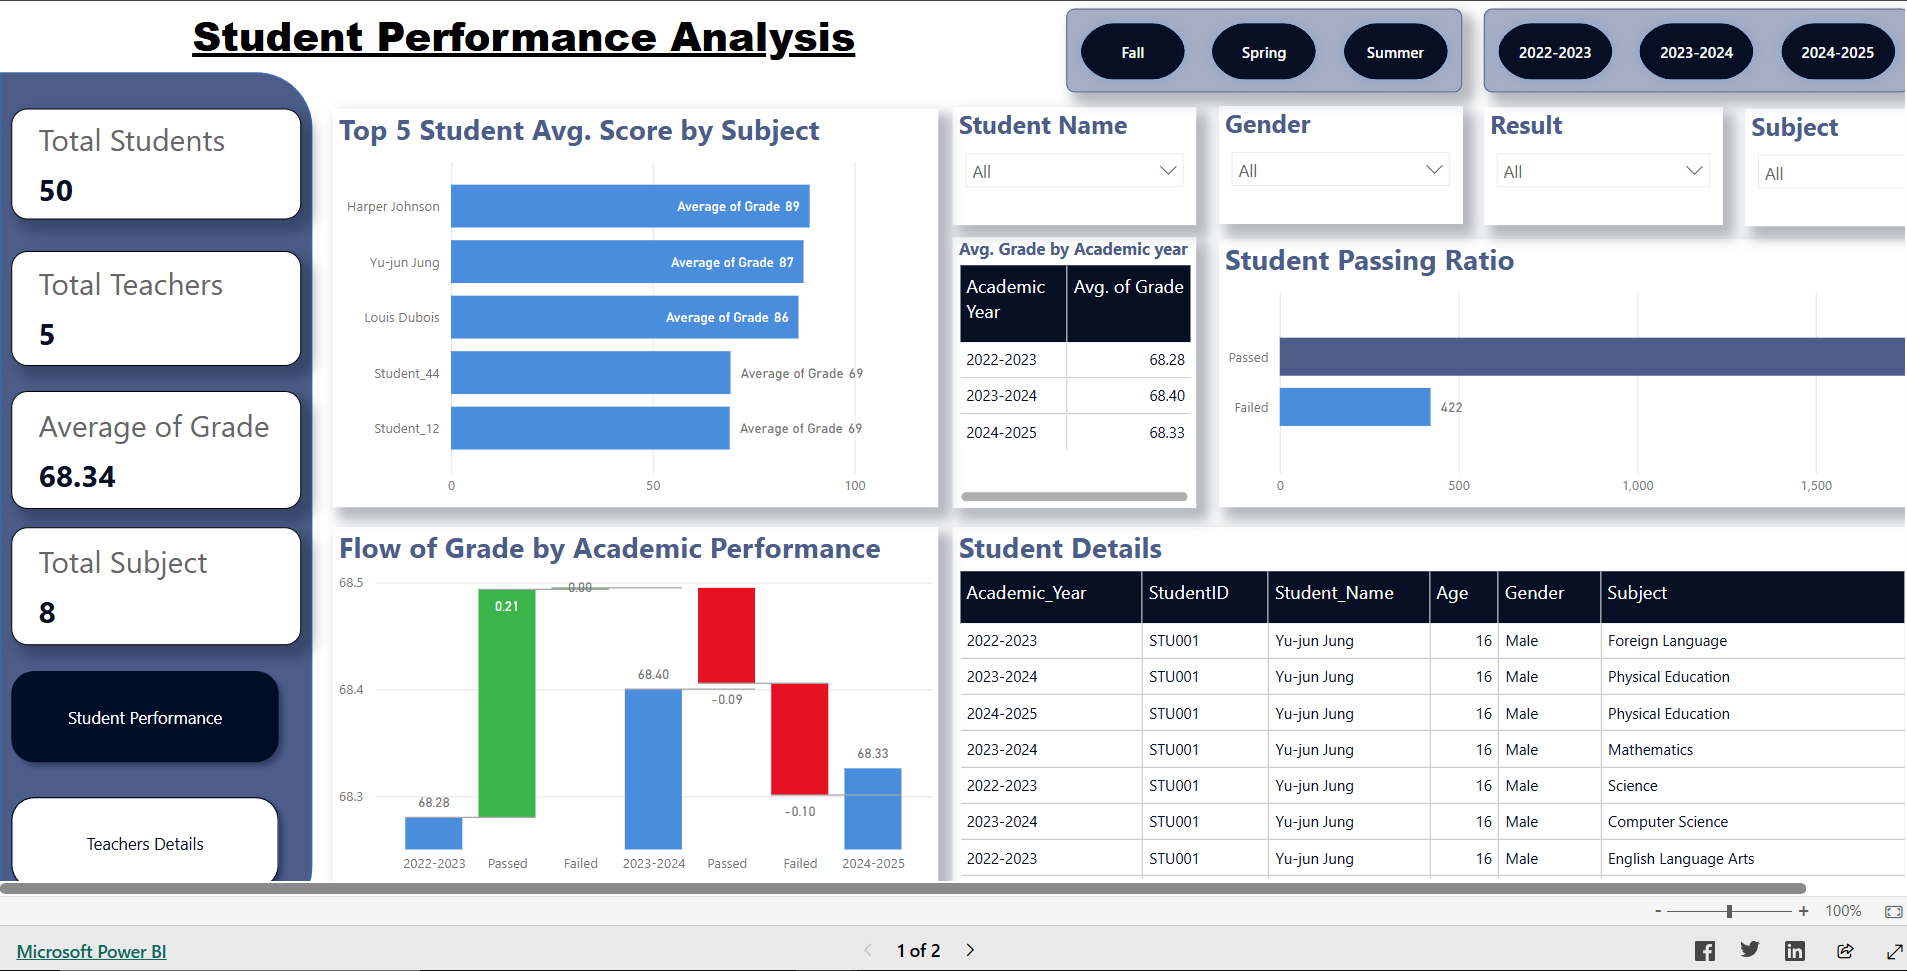
To address this, we developed an AI-powered Student Performance Dashboard using Power BI, enabling academic leaders to track student progress, teaching effectiveness, and departmental performance in real time.
Result: The institution transitioned from reactive reporting to data-driven academic planning, improving transparency, accountability, and learning outcomes.
Key KPIs Tracked
These KPIs were designed to give educators and administrators clear visibility into student performance, teaching quality, and institutional effectiveness, all presented through a centralized power bi academic dashboard that transforms complex academic data into actionable insights.
- Grade Flow by Academic Performance: Tracks how students move between grades year-over-year, highlighting the impact of pass/fail outcomes on academic progression.
- Student-wise Grade Details: Provides individual-level performance insights by subject, helping identify strengths, weaknesses, and intervention needs.
- Year-wise Student Trends: Analyzes overall student performance trends across academic years to uncover long-term improvement or decline patterns.
- Year-wise Teaching Trends: Evaluates how teaching effectiveness evolves over time, helping institutions assess curriculum and faculty development impact.
- Teacher-wise Performance Details: Offers individual teacher performance metrics, linked to student outcomes and grade improvements.
- Department Performance Ranking: Ranks departments based on student results, identifying top-performing and underperforming departments.
- Effective Teaching by Grade: Measures how teacher contributions influence student grades, highlighting instructional impact across performance levels.
- Teacher Experience (Average): Shows the average years of teaching experience, enabling analysis of faculty maturity across departments.
- Years of Experience vs Salary: Analyzes the relationship between teaching experience and compensation, supporting HR and policy decisions.
- Pass/Fail Percentage: Tracks the proportion of passed and failed students, offering a clear academic health indicator at institutional level.
Solution Offered — AI-Based Student Performance Dashboard Development
We implemented a structured five-step approach to build a scalable and insight-rich Student Performance Analytics Dashboard, enabling academic institutions to monitor learning patterns and faculty impact with clarity.
Data Integration & Academic Data Preparation
We consolidated data from student information systems, exam records, faculty databases, and HR systems to build a unified academic dataset.
Data was cleaned, standardized, and validated to ensure accuracy across student grades, teaching records, and departmental structures.

Analytical Modeling & Performance Metrics
We applied statistical analysis and machine learning techniques to evaluate grade progression, teaching effectiveness, and performance variance across years.
Patterns related to pass/fail outcomes, subject difficulty, and instructor impact were identified to support evidence-based decision-making.

Dashboard Design & Visualization
A custom Power BI dashboard was designed to present student, teacher, and department-level insights in a clear and intuitive format.
Interactive charts, rankings, and drill-down views allowed academic leaders to explore performance data without technical complexity.

Automation & Continuous Updates
The system was automated to refresh data regularly as new academic results, evaluations, and faculty updates became available.
This ensured leadership teams always had up-to-date insights without manual reporting delays.

Collaboration, Alerts & Insight Sharing
Dashboards were made shareable across academic leadership, department heads, and quality assurance teams.
Alerts highlighted critical trends such as rising failure rates, declining department performance, or unusual shifts in teaching outcomes.

Main Features of the Student Performance Dashboard
The dashboard is designed and developed by our team to support academic excellence and accountability, the dashboard delivers:
Business Benefits of AI-Powered Academic Analytics
The power bi student analytics dashboard empowers institutions to improve outcomes through data-driven decision-making.
01
Improve Student Outcomes
Identify at-risk students early and take targeted academic interventions.
02
Enhance Teaching Effectiveness
Evaluate instructional impact and support faculty development initiatives.
Strengthen Department Accountability
Benchmark departments using transparent, performance-based metrics.
04
Support Strategic Workforce Planning
Align teacher experience, compensation, and performance for long-term sustainability.
05
Enable Data-Driven Academic Governance
Replace intuition-based decisions with real-time, measurable academic insights.
Who Gains Actionable Insights from This Dashboard?
Tech Stack Used
The RTO Data Analysis Dashboard utilizes a powerful technology stack to ensure accuracy, scalability, and actionable insights:
Power BI

Azure Analytics Service

Python & SQL
Results Achieved
The academic institution gained measurable improvements in visibility and decision-making:
Key Results:
The dashboard enabled a shift from static academic reports to continuous performance intelligence, supporting better learning outcomes and institutional excellence.