Key Takeaways:
- A complete full-funnel Ecommerce Analytics Framework, connecting traffic, product behavior, conversions, revenue, and retention into one unified Power BI dashboard for fast, data-driven decision-making.
- Centralized reporting across Shopify/Magento, GA4, Ads platforms, CRM, and marketplaces, allowing ecommerce teams to track CAC, ROAS, LTV, margins, and profitability with real-time accuracy.
- Actionable insights across acquisition, product engagement, checkout behavior, and customer lifecycle, helping brands optimize campaigns, reduce drop-offs, scale high-LTV cohorts, and boost overall ecommerce growth.
Ecommerce brands today operate across Shopify or Magento, GA4, Meta Ads, Google Ads, CRM platforms, email automation, marketplaces, and spreadsheets. Each system reveals a fragment of performance, but none of them show the full journey—from traffic all the way to retention. This lack of unified visibility leads to poor attribution, slower decisions, and missed growth opportunities.
An Ecommerce Analytics Dashboard in Power BI solves this by consolidating the entire funnel into one real-time, interactive dashboard. It connects marketing, product, sales, operations, and retention insights, helping brands understand exactly what drives revenue, what blocks conversions, and where to optimize next. This blog explains how Power BI for Ecommerce Analytics transforms decision-making for modern ecommerce teams.
Why Ecommerce Brands Need a Full-Funnel Power BI Dashboard?
Ecommerce data is scattered across multiple tools, making it difficult to understand the complete customer journey. A full-funnel Power BI dashboard brings clarity and alignment across teams.
1. Fragmented Systems and Missing Connections
Most ecommerce brands rely on GA4 for traffic insights, Shopify or Magento for orders, and Ads platforms for acquisition. Since these tools don’t integrate seamlessly, teams often compare mismatched numbers.
Power BI creates a unified ecommerce BI dashboard where every metric flows from a single, trusted dataset. Even global brands like Nike and Sephora use centralized BI layers to avoid discrepancies between marketing and sales figures.
2. No Real-Time Visibility Into Funnel Movement
Relying on exports or weekly reports causes delays in reacting to performance drops. Power BI enables near real-time refresh cycles so brands like Walmart and Target can track sales velocity, ad spikes, and funnel health as they happen. This reduces reaction times and gives teams the ability to fix issues before they lead to revenue loss.
3. Limited View of CAC, ROAS & Profitability
Ad platforms provide top-of-funnel conversion data but lack margin and product cost context. Ecommerce platforms show revenue but exclude acquisition cost. Power BI blends these metrics, allowing companies from D2C brands to enterprise retailers to evaluate profitability at SKU, category, and campaign levels.
Full-Funnel Breakdown: What Your Power BI Dashboard Should Include
A high-performing Ecommerce Analytics Dashboard in Power BI does not track metrics in isolation. It gives teams visibility across traffic quality, product engagement, conversion behavior, sales patterns, and customer lifetime value.
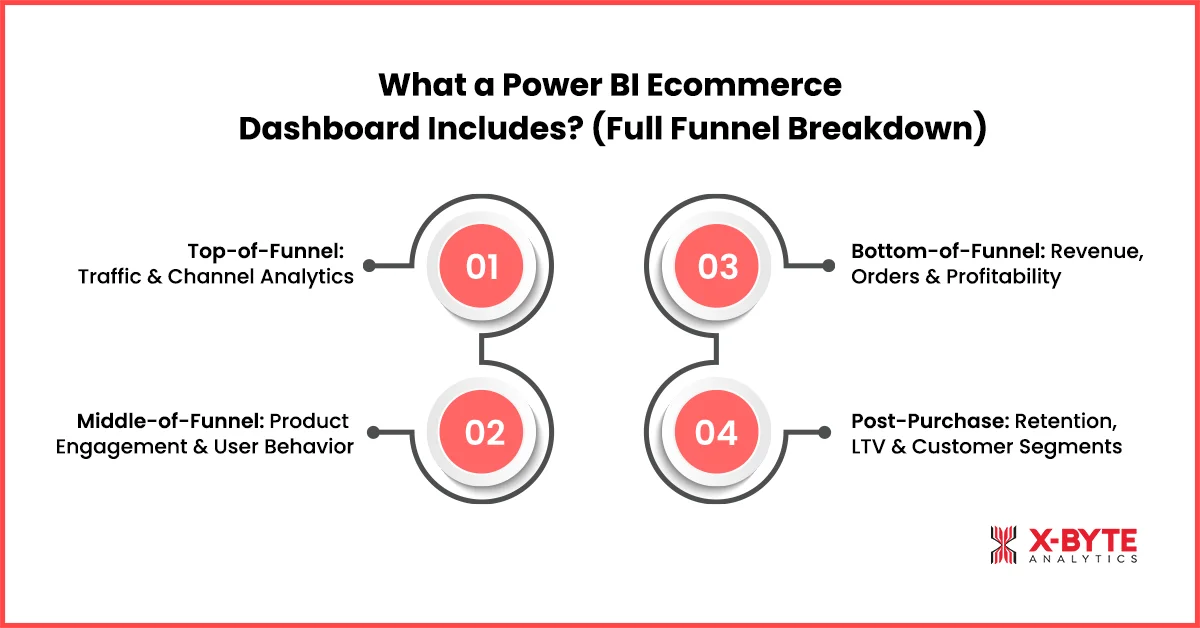
1. Top-of-Funnel: Traffic & Channel Analytics
Power BI integrates GA4 and advertising data to reveal how effectively your website attracts and engages users. It highlights which channels deliver high-intent customers, where they land, and how they behave before reaching product pages.
- Channel Performance & Quality of Traffic
With GA4 and Ads data combined, Power BI helps identify which channels such as organic, paid, social, email, or affiliates deliver qualified visitors. Brands like Amazon and Best Buy use similar funnel-level visibility to optimize budget allocation and scale profitable acquisition campaigns.
- Landing Page Behavior & Device Insights
Poor mobile experiences, slow pages, or irrelevant landing pages are major conversion blockers. Power BI provides scroll-depth, bounce rate, and engagement insights across devices, helping teams prioritize user experience improvements.
2. Middle-of-Funnel: Product Engagement & User Behavior
This layer blends GA4, CRM, and Shopify/Magento data to illustrate how shoppers interact with your product catalog and where they drop off before converting.
- Product Views to Add-to-Cart Conversion Flow
Power BI helps identify SKUs with high impressions but low add-to-cart rates, indicating issues with product positioning, images, or price. This is how brands like H&M and Uniqlo optimize product pages before investing heavily in ad spend.
- Category-Level Conversions & Checkout Insights
Understanding which categories drive conversions—and which ones create friction—helps teams prioritize CRO efforts. Power BI highlights bottlenecks in the add-to-cart and checkout process, guiding improvements that reduce abandonment.
3. Bottom-of-Funnel: Revenue, Orders & Profitability
This section connects transactional data, revenue metrics, margin analysis, and channel attribution into one place, making it easy to evaluate what drives profit—not just orders.
- Revenue & Conversion Metrics Across All Channels
Power BI visualizes CR%, AOV, order volume, and revenue distribution across products and categories. Enterprise brands like Walmart and Target rely on similar BI dashboards to manage real-time sales trends during peak periods.
- Profitability, Margin & True ROAS
A dedicated Ecommerce ROAS Dashboard in Power BI goes beyond platform-reported ROAS by combining ad spend, product cost, shipping, and margins. This holistic view helps teams stop campaigns that look profitable on the surface but drain net profit.
4. Post-Purchase: Retention, LTV & Customer Segments
Long-term growth comes from understanding customer value beyond the first purchase. Power BI connects order history with CRM workflows to measure the full customer lifecycle.
- LTV, Repeat Purchase Behavior & Cohort Trends
By visualizing customer behavior over time, Power BI helps brands understand which acquisition channels bring the highest-LTV customers. Models used by brands like Starbucks and Sephora show how cohorts respond to promotions, emails, and retargeting efforts.
- Customer Segmentation & Churn Indicators
Power BI classifies customers into segments like loyal buyers, first-time purchasers, high-value customers, and churn risks. This creates the foundation for targeted retention campaigns and personalized messaging.
Key Ecommerce KPIs Your Dashboard Should Track
Power BI makes KPI tracking actionable rather than static. These KPIs provide clarity across performance, revenue, and retention.
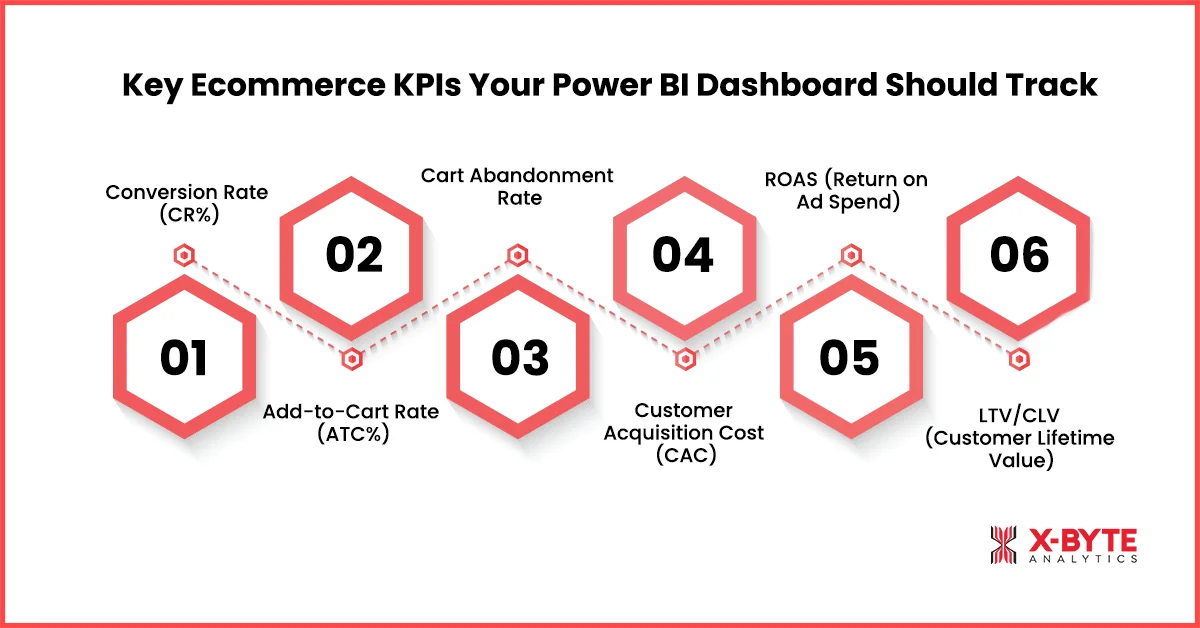
1. Conversion Rate (CR%)
CR% helps evaluate the effectiveness of website design, product pages, and traffic quality. Power BI allows comparisons by device, source, and campaigns to uncover deeper patterns.
2. Add-to-Cart Rate (ATC%)
A low ATC% often indicates issues with pricing, product details, imagery, or messaging. Power BI highlights SKUs with large drop-offs between views and carting, enabling faster CRO decisions.
3. Cart Abandonment Rate
High abandonment signals checkout friction—such as shipping cost surprises or poor payment options. Power BI breaks this down by traffic source, device, and user behavior to pinpoint causes.
4. Customer Acquisition Cost (CAC)
CAC becomes far more accurate when Power BI integrates spend from all ad platforms and compares it against attributed purchases.
5. ROAS (Return on Ad Spend)
A unified view across Meta, Google, TikTok, and email campaigns helps teams understand blended ROAS, channel ROAS, and true profitability at scale.
6. LTV/CLV (Customer Lifetime Value)
LTV reveals how much revenue a customer brings throughout their relationship with the brand.
Power BI connects first-party customer data with purchase history to uncover high-LTV segments, enabling smarter budgeting, retention workflows, and cohort-specific campaigns.
How Power BI Connects All Ecommerce Systems Together?
Power BI Integration enables a seamless blend of:
- Shopify/Magento/WooCommerce
- GA4
- Meta, Google, TikTok Ads
- CRM platforms like Klaviyo, HubSpot, Zoho
- Marketplaces such as Amazon, eBay, Flipkart
This multi-source pipeline ensures that teams from marketing to operations operate with the same numbers. Brands like Nike and Walmart use similar BI models to centralize global ecommerce reporting.
Learn more about our power bi ecommerce dashboard development approach.
Best Practices for Building a High-Performing Ecommerce Dashboard
A high-performing ecommerce dashboard brings together your marketing, product, sales, and customer data to give you a complete view of business performance. Instead of tracking scattered KPIs, it helps teams identify trends, locate drop-offs, and uncover revenue opportunities faster. With the right structure, real-time updates, and role-based views, your dashboard becomes a powerful engine for smarter decision-making.
1. Track the Entire Funnel Together
Isolated metrics hide important insights. Power BI connects impressions, product engagement, add-to-cart behavior, conversion actions, and repeat purchases into a single flow, revealing where customers drop off.
2. Blend Marketing, Product & Revenue Data
True insights require merging ads, product performance, inventory levels, and revenue metrics. Enterprise retailers use the same approach to uncover high-margin opportunities.
3. Use Real-Time or Frequent Refresh
During sale days or heavy traffic periods, data needs to refresh every 5–15 minutes to monitor anomalies like stockouts, rising CAC, or sudden drops in conversions.
4. Build Views for Each Team
CEOs get high-level performance snapshots, CMOs get acquisition metrics, product teams get PDP insights, and operations gets inventory visibility—all within the same dashboard.
Explore how we build ecommerce analytics dashboards for fast-scaling brands.
Looking To Build The Perfect Ecommerce BI Setup? Talk To Our Power BI Experts.
Conclusion
A unified Ecommerce Analytics Dashboard in Power BI gives teams the visibility they’ve always lacked. Instead of switching between multiple tools and manually stitching data, brands gain a single view of their entire business—from acquisition to retention. This enables faster decision-making, more accurate attribution, better inventory planning, and full visibility into margin performance across all channels.
As ecommerce competition intensifies, data-driven execution becomes the strongest competitive advantage. With Power BI Dashboard Development tailored for ecommerce, brands can reduce wasted ad spend, improve customer experience, scale high-LTV cohorts, and operate with complete confidence in their numbers. Whether you’re managing a D2C store or running multi-channel retail operations, a Power BI ecosystem ensures you grow with clarity, speed, and profitability.
Talk to our experts to build a tailored power bi dashboard development solution for your ecommerce brand.