Take full control of your logistics operations with X-Byte Analytics’ Power BI Logistics Dashboard Services. Our enterprise logistics dashboard in Power BI delivers real-time visibility across warehouse inventory, fleet performance, shipments, and last-mile delivery operations. Built as a custom logistics dashboard in Power BI, it helps you reduce costs, optimize delivery performance, and drive data-backed operational decisions at scale.


A Power BI logistics dashboard is a centralized analytics interface that integrates data from ERP systems, warehouse management systems, fleet telematics, and shipping carriers to deliver a real-time, unified view of logistics performance. As part of our logistics dashboard development services, this dashboard allows leaders to track critical KPIs such as on-time delivery, fleet utilization, warehouse efficiency, and profitability from a single source of truth.
With our Power BI logistics dashboard consulting, organizations gain proactive decision-making capabilities by instantly identifying inefficiencies, delivery delays, and cost leakages. Powered by advanced analytics, the dashboard also supports forecasting, trend analysis, and intelligent resource optimization across the end-to-end supply chain.
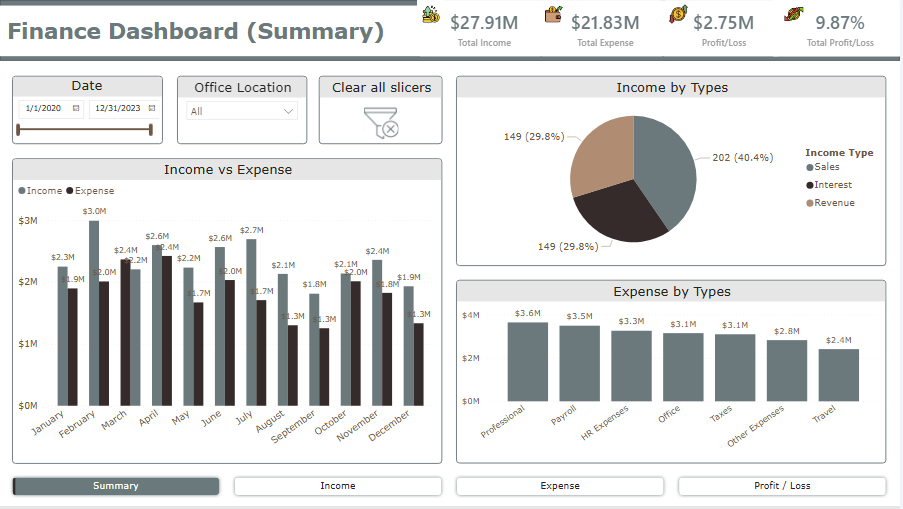
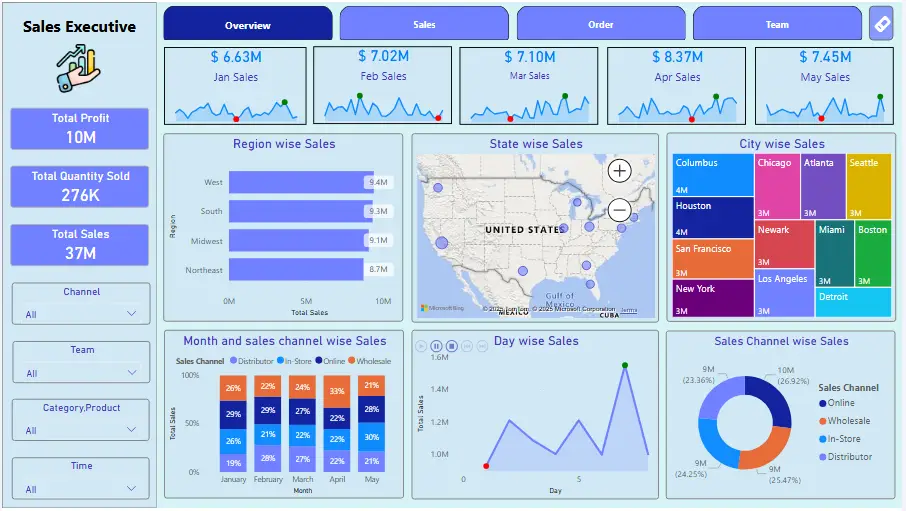
Our logistics KPI dashboard in Power BI tracks real-time cost, speed, reliability, and profitability metrics across your entire logistics operation. From landed delivery cost and fleet efficiency to return rates and customer satisfaction, every KPI is engineered to drive faster, data-driven decisions for enterprise-scale logistics networks.
Our Power BI logistics dashboard gives a unified, real-time view of warehouse, fleet, delivery, and cost performance for faster, data-driven decisions.
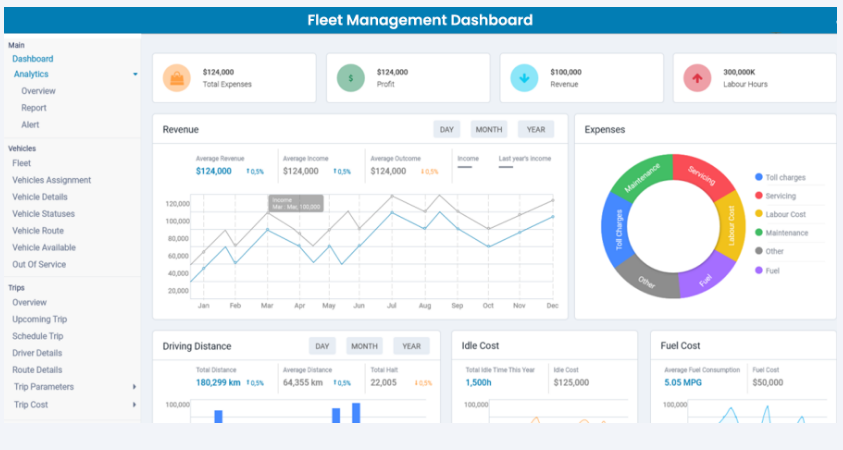
Our enterprise Power BI logistics dashboard is designed for leadership and operations teams that require real-time control over cost, delivery performance, warehouse efficiency, and customer satisfaction. By unifying fleet management, warehouse operations, last-mile delivery, and financial KPIs, this dashboard enables faster decisions, lower operational losses, and sustained service excellence.

Enterprise logistics operations are high-volume, time-sensitive, and margin-driven. A Power BI transportation and logistics dashboard allows leadership to maintain real-time control over performance, costs, and service quality while proactively managing risks across multi-warehouse and multi-fleet networks.
Why It’s Critical for Enterprises:


Track landed cost per delivery, fleet cost per km, and return handling costs to eliminate profit leakages.


A leading US-based financial services firm faced increasing challenges…
Result:
28% pipeline success rate
22% Faster Alert Resolution Time

A well-known French perfume retailer wanted to increase profits during the busiest shopping months….
Result:

A leading U.S. financial institution struggled with slow and inconsistent loan approvals…
Result:
40% Decrease in Approval Time
25% Accuracy in Credit Score


Built on secure, governed ETL pipelines with precise data modeling to guarantee accuracy and reliability at scale.